")
Austerity in England linked to more than 50,000 extra deaths in five years
Researchers looked at 2010-2015 when Tory and Lib-Dem cuts to NHS and social care were starting to bite.
Austerity cuts to the NHS, public health and social care have killed tens of thousands more people in England than expected, according to the largest study of its kind.
Research by the University of York analysed the joint impact of cuts to healthcare, public health and social care since 2010 found that even in just the following four years the spending squeeze was linked with 57,550 more deaths than would have been expected. The findings, worse than previously thought, were revealed in the journal BMJ Open.
Researchers also found that a slowdown in life expectancy improvement coincided with the government’s sharp cuts to health and social care funding after David Cameron came to power a decade ago.
“Restrictions on the growth in health and social care expenditure during ‘austerity’ have been associated with tens of thousands more deaths than would have been observed had pre-austerity expenditure growth been sustained,” said Prof Karl Claxton of the Centre for Health Economics at the University of York.
“Our results are consistent with the hypothesis that the slowdown in the rate of improvement in life expectancy in England and Wales since 2010 is attributable to spending constraints in the healthcare and social care sectors.”
Researchers said real social care spending rose by 2.2% per capita of the population between 2001-02 and 2009-10, but fell by 1.57% between 2010-11 and 2014-15. The loss of social care funding caused 23,662 additional deaths, according to the findings.
Real healthcare spend per capita rose by 3.82% between 2001-02 and 2009-10, but only by 0.41% between 2010-11 and 2014-15. The cuts to healthcare spending between 2010-11 and 2014-15 led to 33,888 extra deaths, the researchers calculated.
In total, the study suggested the constraints on health and social care spending during this period of austerity have been associated with 57,550 more deaths up to 2014 than would have been expected if funding had stayed at pre-2010 levels.

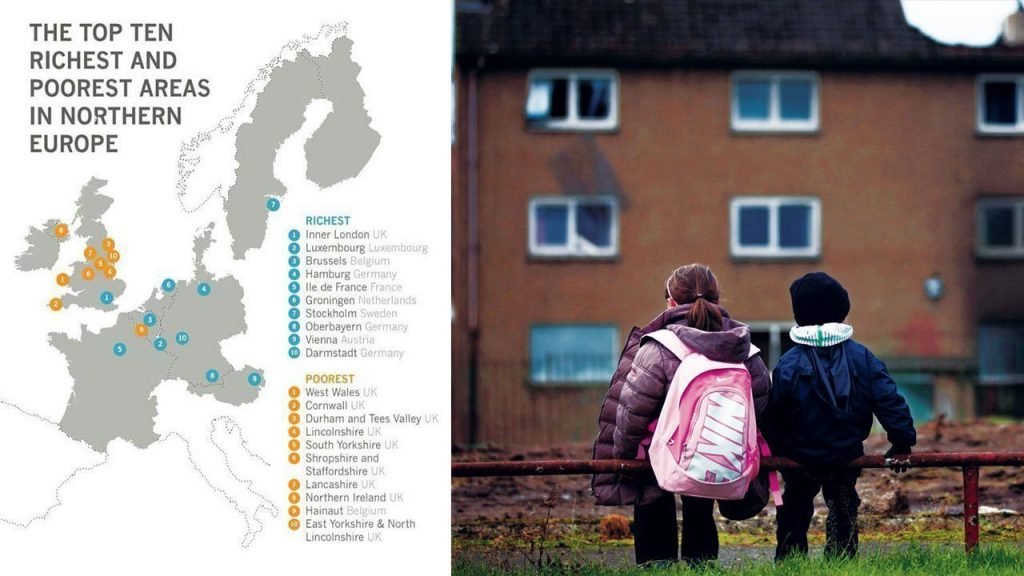
The difference in expected lifespan between some of the wealthiest and poorest areas has more than doubled since the early 2000s, research finds
Research showed England’s richest people are living for a decade longer than the poorest, and the life expectancy gap between them has widened to “a growing chasm”, research has revealed.
The difference in expected lifespan between some of the wealthiest and poorest areas has more than doubled since the early 2000s, an analysis of official data by the King’s Fund shows.
“There is a growing chasm in health inequalities revealed by the data,” said Veena Raleigh, a fellow at the thinktank who specialises in the stark differentials in rich and poor people’s health.
“Our analysis shows that life expectancy has continued to increase in wealthier areas but has virtually stagnated in deprived areas in the north with the result that the gap in life expectancy between the richest and poorest parts of the country has grown by almost two-and-a-half years over the last two decades.”
For example, in well-off Westminster male life expectancy rose from 77.3 to 84.7 years between 2001-03 and 2018-20 – a jump of 7.4 years. But men in deprived Blackpool only saw their expected longevity increase over the same period from 72 to 74.1 years, a rise of only 2.1 years. So overall the gap in life expectancy widened from 5.3 to 10.7 years in less than 20 years.
Raleigh found the same pattern for women in the two places when she examined Office for National Statistics (ONS) data. While life expectancy shot up for women in Westminster from 82.3 to 87.1 years, among those in Blackpool it only edged up from 78.4 to 79 years, a rise of just 0.6 years. That means that the difference in expected lifespan more than doubled from 3.9 to 8.1 years.
Covid has exacerbated the north-south divide, as well as the “deprivation divide”, in life expectancy, Raleigh added. In 2001-03 the gap was widest – at 8.2 years – between Hart in Hampshire and Manchester. But it is now the 10.7-year differential between Westminster and Blackpool. Similarly, the biggest gap in female life expectancy has widened from 6.6 years to the 8.9-year differential between women in Kensington and Chelsea in London and Blackpool.
Separate research by Imperial College London, published in ‘The Lancet Public Health journal’, found life expectancy in many communities in England was falling even before the pandemic.
While life expectancy rose in most places during the first decade of the millennium, from 2010 in some areas it started to decline. By 2014 that deterioration had accelerated, researchers discovered, with life expectancy falling for women in almost one in five communities (18.7%), and for men in one in nine places (11.5%).
The worst-hit areas were typically in urban areas in the north. They include Blackpool, Leeds, Liverpool, Manchester and Newcastle.
Researchers have made various attempts at calculating the true impact of the austerity measures led by Cameron. But the University of York study is the first to jointly analyse the effect of the significant slowdown in NHS, public health and social care spending on death rates in England.
How and why did trends in life expectancy change after 2011?
Independent research by the King’s Fund showed much of the same.
2011 marked a turning point in long-term mortality trends, with improvements tailing off after decades of steady decline. In the 100 years to 2010–12, life expectancy increased by nearly 3 years every decade, but between 2011 and 2019 it increased by only 0.8 years for males and 0.6 years for females, having virtually flat-lined between 2014–18. However, in 2019 life expectancy increased by 0.3 years in males and 0.4 years in females and in January–March 2020, before the Covid-19 pandemic took effect, mortality was again at the lower level seen in 2019. The life expectancy gains in 2019 and the fall in mortality in early 2020 were associated with mild influenza (flu) seasons and troughs in winter mortality.
One year deserves special mention – 2015, when life expectancy fell across virtually all of Europe. In England there were an estimated 28,000 deaths associated with flu and life expectancy fell by 0.2 years in both males and females – unprecedented for decades until the Covid-19 pandemic in 2020. As in Europe, most ‘excess’ deaths in 2015 occurred among older people, with deaths from respiratory disease (including flu and pneumonia) being a key contributor to the largest annual rise in deaths since the 1960s.
A review of mortality trends in England to 2017 found that improvements in life expectancy since 2010 had slowed in most areas of England and among all socio-economic groups, but the slowdown was greater among the most deprived groups and inequalities had widened. Slowing mortality improvements among people aged 50 years and over played a significant role.
The reasons for the post-2011 slowdown in life expectancy improvements are unclear and have been hotly debated.
North-south divide
People living in more affluent areas live significantly longer than people living in deprived areas. In 2017–19, males in the least deprived 10 per cent of areas in England could expect to live to 83.5 years, almost a decade longer than males in the 10 per cent most deprived areas (74.1 years). Females in the least deprived 10 per cent of areas in England could expect to live to 86.4 years, compared with 78.7 years for females in the most deprived areas, a difference of almost 8 years. Much of this inequality is caused by higher mortality from heart and respiratory disease, and lung cancer in more deprived areas. The male–female difference in life expectancy is greater in more deprived areas: for example, females in the most deprived areas live 4.6 years longer than males, compared with a difference of 2.9 years in the least deprived areas.
The rich–poor gap in healthy life expectancy is even greater – almost two decades – than the gap in life expectancy. Those living in the most deprived areas spend nearly a third of their lives in poor health, compared with only about a sixth for those in the least deprived areas. Males in the most and least deprived areas spent 21.8 and 12.8 years respectively in poor health; for females, the corresponding figures were 27.3 and 15.3 years. Hence, not only do people living in the most deprived areas have the shortest life spans, they also live more years in poor health.
Socio-economic inequalities in life expectancy are widening as a result of greater gains in life expectancy in the least deprived populations. Males and females living in the least deprived areas of England saw a significant increase in life expectancy between 2014–16 and 2017–19; in the most deprived areas no significant changes were observed.
While mortality has declined everywhere, there is a persistent north–south divide in life expectancy and healthy life expectancy, with people in southern regions on average living longer and with more years in good health than those living further north. For example, in 2017–19, life expectancy for males was about eight years lower and for females about seven years lower in Blackpool, Middlesbrough, Manchester and Liverpool than in Kensington and Chelsea, Camden, and Westminster. The gap in years lived in good health across local authorities in England was even greater, about 17 years.
Some population groups have significantly shorter life expectancy than the general population. For example, homeless males and females live 31 years and 38 years fewer years respectively than males and females on average. People with learning disabilities also have shorter lives than the average, by 23 years among males and 27 years among females.
About 14 per cent of the population of England is non-white. Life expectancy data is not yet available by ethnic group because ethnicity is not currently recorded at death registration but, following the disproportionate impact of Covid-19 on ethnic minority communities, the government has said it will be introduced in England (Scotland introduced it in 2012).
Boris Johnson last month pledged a £12bn-a-year cash injection to help the NHS catch up after the pandemic and to overhaul social care. Household budgets will take a hit from next April when employees’ national insurance contributions will rise by 1.25% to pay for the funding boost.
The Department of Health and Social Care has been approached for comment.
Support Independent Journalism Today
Our unwavering dedication is to provide you with unbiased news, diverse perspectives, and insightful opinions. We're on a mission to ensure that those in positions of power are held accountable for their actions, but we can't do it alone. Labour Heartlands is primarily funded by me, Paul Knaggs, and by the generous contributions of readers like you. Your donations keep us going and help us uphold the principles of independent journalism. Join us in our quest for truth, transparency, and accountability – donate today and be a part of our mission!
Like everyone else, we're facing challenges, and we need your help to stay online and continue providing crucial journalism. Every contribution, no matter how small, goes a long way in helping us thrive. By becoming one of our donors, you become a vital part of our mission to uncover the truth and uphold the values of democracy.
While we maintain our independence from political affiliations, we stand united against corruption, injustice, and the erosion of free speech, truth, and democracy. We believe in the power of accurate information in a democracy, and we consider facts non-negotiable.
Your support, no matter the amount, can make a significant impact. Together, we can make a difference and continue our journey toward a more informed and just society.
Thank you for supporting Labour Heartlands


